Sources, Notices
* Value is calculated with linear interpolation from 2 nearest estimated (date->population) data (unofficial).
** Net migration is included in Births with this calculation: Births = Population[1] + Deaths[1].
*** For years before 1950 we dont have population data. Value is approximate calculation using function: 1900 population = 70% of 1950 population.
[1] United Nations, Department of Economic and Social Affairs, Population Division (2015). World Population Prospects: The 2015 Revision. Data are estimates and projections according to a medium-fertility variant. Reused with the permission of the United Nations. Downloaded: 2015-11-15
(un.org)
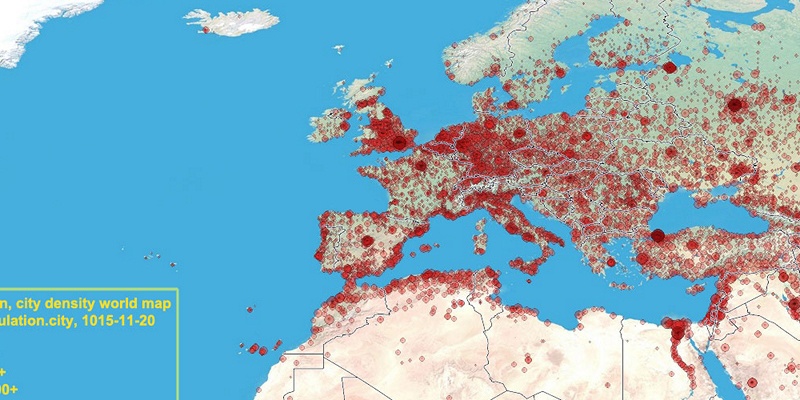
[2] City density map, generated by population.city using data provided to us by 1km.net website. Every circle is city with population over 5000.
Link
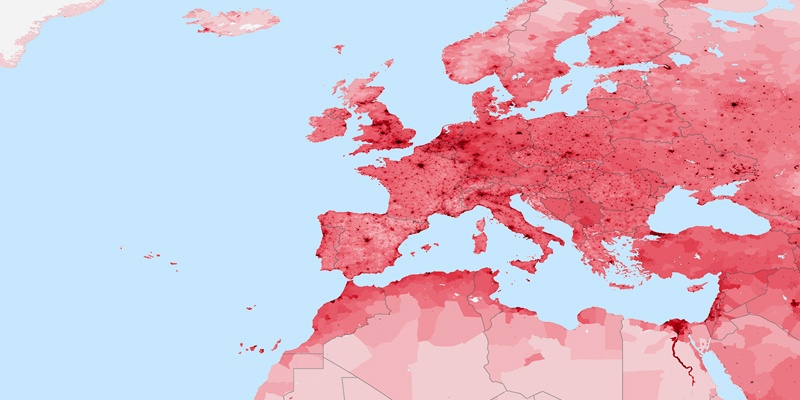
[3]
Population density map generated by instructions from daysleeperrr on reddig.
Link1.
Used data source is the Gridded Population of the World (GPW), v3 online at the the Socioeconomic Data and Applications Center (SEDAC) at Columbia University.
Link2.
Additional urban land cover: Extracted from Global Land Cover Characteristics Data Base Version 2.0 and Binary MOD12Q1 data on shadedrelief.com.
Link3 (PNG,0.5Mb).