New Zealand · Population

On this page you can find past, current and future population statistics for New Zealand (from 1950-2100), population map, demographics, live population counter etc. . Question: What is the population of New Zealand? Answer: Current population of New Zealand is: 4 878 785*[1], area 268680 km², population density 18.16 p/km². Capital of New Zealand is Wellington. Continent: Oceania.

↓ Population for cities ↓  

New Zealand · Population 1950-2100

New Zealand · historical and predicted populations (both sexes) for the period 1950-2100 (millions) De facto population in New Zealand as of 1 July of the year indicated. Source United Nations Population Division [1].

What was the New Zealand population at your birthday?*

Enter your birth date to find out. [1]

year:***
month:
day:

Current New Zealand population

4 878 785

Today This year
Population growth Today
xx
Changes every 862.609 sec.
Population growth This year
xx
Births Today
xx
Changes every 461.394 sec.
Births This year
xx
Deaths Today
xx
Changes every 991.995 sec.
Deaths This year
xx

Sources: [1]
Today's statistic since midnight 00:00.
This year, statistic changes since 1st January
Population = Births** - Deaths

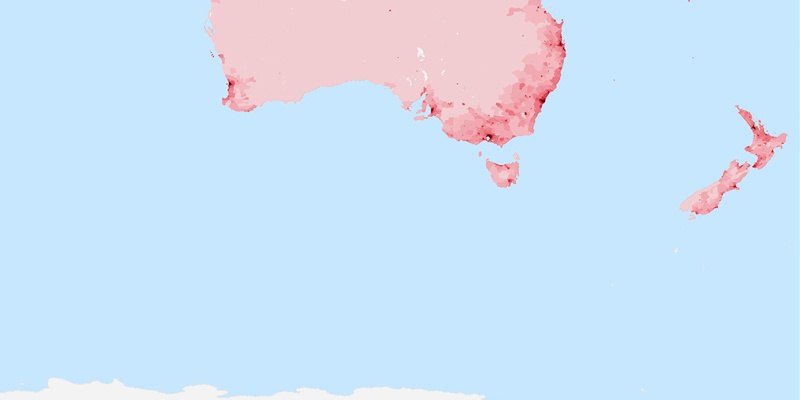
New Zealand population map

City density [2]population density [3]Legend (Click on marker to hide it)
• Population Growth rate: 100 / day = 4.17 / hour = 0.07 / minute = 0.0012 / seconds
• Births Growth rate**: 187 / day = 7.83 / hour = 0.13 / minute = 0.002 / seconds
• Deaths Growth rate: 87 / day = 3.63 / hour = 0.06 / minute = 0.001 / seconds.

Current New Zealand population by age and sex for 2025-01-25*

  Male % Female
0-4 137 800 ⇐+4.1% 132 404
5-9 173 759 ⇐+4.1% 166 892
10-14 160 191 ⇐+1.9% 157 147
15-19 141 491 ⇐+3.3% 136 951
20-24 179 256 ⇐+7.6% 166 612
25-29 181 865 ⇐+2.6% 177 314
30-34 148 419 +7.2%⇒ 159 075
35-39 117 627 +7.9%⇒ 126 960
40-44 117 339 +13.2%⇒ 132 885
45-49 143 783 +15%⇒ 165 328
50-54 148 030 +12%⇒ 165 821
55-59 175 176 +10.8%⇒ 194 059
60-64 136 088 +9.7%⇒ 149 245
65-69 129 485 +9.1%⇒ 141 217
70-74 125 441 +6.8%⇒ 134 027
75-79 75 756 +13.4%⇒ 85 880
80-84 42 414 +17.8%⇒ 49 968
85-89 23 750 +13.1%⇒ 26 851
90-94 17 557 +48%⇒ 25 978
95-99 2 378 +144.2%⇒ 5 808
100+ 188 +202.1%⇒ 568

Sources: [1]

Ads

age of mother

Childrens per woman

Life expectancy at birth

First letter of the City


Filter by starting letters of the city (84 cities):
A (3) | B (2) | C (5) | D (3) | F (2) | G (3) | H (4) | I (1) | K (6) | L (3) | M (5) | N (5) | O (3) | P (5) | Q (1) | R (3) | S (3) | T (11) | U (1) | W (15) |

Population for cities or regions in New Zealand (84)

This is not full list. Only 50 largest cities in alphabetical order. You can click on start letter of the city ↑ :
Ashburton Canterbury
Auckland Auckland
Blenheim Marlborough
Cambridge Waikato
Central Auckland Auckland
Christchurch Canterbury
Dunedin Otago
Feilding Manawatu-Wanganui
Gisborne Gisborne
Gore Southland
Greymouth West Coast
Hamilton Waikato
Hastings Hawke's Bay
Hawera Taranaki
Huntly Waikato
Invercargill Southland
Kapiti Wellington
Levin Manawatu-Wanganui
Lower Hutt Wellington
Masterton Wellington
Matamata Waikato
Motueka Tasman
Napier Napier City Hawke's Bay
Napier-Hastings Hawke's Bay
Nelson Nelson
New Plymouth Taranaki
Northern Auckland Auckland
Oamaru Otago
Palmerston North Manawatu-Wanganui
Porirua Wellington
Pukekohe Auckland
Queenstown Otago
Rangiora Canterbury
Rolleston Canterbury
Rotorua Waikato
Southern Auckland Auckland
Taupo Waikato
Tauranga Bay of Plenty
Te Awamutu Waikato
Te Puke Bay of Plenty
Timaru Canterbury
Tokoroa Waikato
Upper Hutt Wellington
Waiheke Island Auckland
Waiuku Auckland
Wanganui Manawatu-Wanganui
Wellington Wellington
Western Auckland Auckland
Whakatane Bay of Plenty
Whangarei Northland

Sources, Notices

* Value is calculated with linear interpolation from 2 nearest estimated (date->population) data (unofficial).
** Net migration is included in Births with this calculation: Births = Population[1] + Deaths[1].
*** For years before 1950 we dont have population data. Value is approximate calculation using function: 1900 population = 70% of 1950 population.
[1] United Nations, Department of Economic and Social Affairs, Population Division (2015). World Population Prospects: The 2015 Revision. Data are estimates and projections according to a medium-fertility variant. Reused with the permission of the United Nations. Downloaded: 2015-11-15 (un.org)
[2] City density map, generated by population.city using data provided to us by 1km.net website. Every circle is city with population over 5000. Link
[3] Population density map generated by instructions from daysleeperrr on reddig. Link1. Used data source is the Gridded Population of the World (GPW), v3 online at the the Socioeconomic Data and Applications Center (SEDAC) at Columbia University. Link2. Additional urban land cover: Extracted from Global Land Cover Characteristics Data Base Version 2.0 and Binary MOD12Q1 data on shadedrelief.com. Link3 (PNG,0.5Mb).