Czech Republic · Population

On this page you can find past, current and future population statistics for Czech Republic (from 1950-2100), population map, demographics, live population counter etc. . Question: What is the population of Czech Republic? Answer: Current population of Czech Republic is: 10 596 803*[1], area 78866 km², population density 134.36 p/km². Capital of Czech Republic is Prague. Continent: Europe.

↓ Population for cities ↓  

Czech Republic · Population 1950-2100

Czech Republic · historical and predicted populations (both sexes) for the period 1950-2100 (millions) De facto population in Czech Republic as of 1 July of the year indicated. Source United Nations Population Division [1].

What was the Czech Republic population at your birthday?*

Enter your birth date to find out. [1]

year:***
month:
day:

Current Czech Republic population

10 596 803

Today This year
Population growth Today
xx
Changes every 6490.64 sec.
Population growth This year
xx
Births Today
xx
Changes every 270.231 sec.
Births This year
xx
Deaths Today
xx
Changes every 281.971 sec.
Deaths This year
xx

Sources: [1]
Today's statistic since midnight 00:00.
This year, statistic changes since 1st January
Population = Births** - Deaths

Czech Republic population map

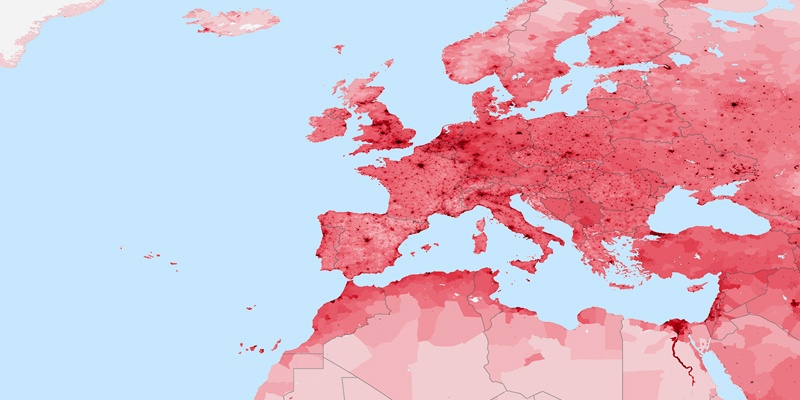
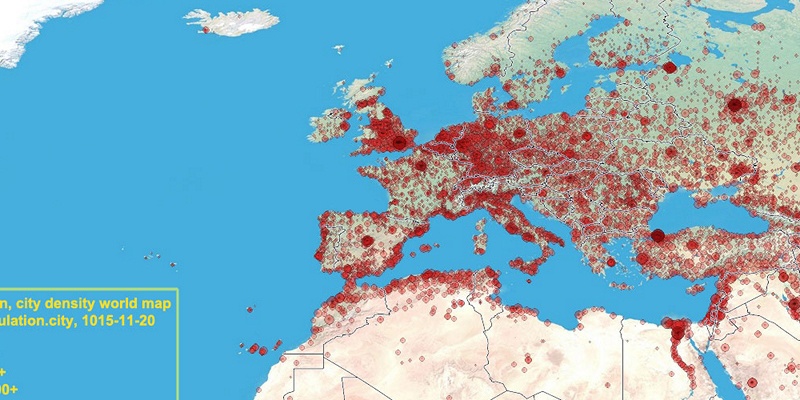
City density [2]population density [3]Legend (Click on marker to hide it)
• Population Growth rate: 13 / day = 0.55 / hour = 0.009 / minute = 0.0002 / seconds
• Births Growth rate**: 319 / day = 13.37 / hour = 0.223 / minute = 0.0035 / seconds
• Deaths Growth rate: 306 / day = 12.77 / hour = 0.213 / minute = 0.0035 / seconds.

Current Czech Republic population by age and sex for 2026-07-10*

  Male % Female
0-4 158 952 ⇐+6.8% 148 882
5-9 342 447 ⇐+5.6% 324 201
10-14 353 047 ⇐+5% 336 096
15-19 184 684 ⇐+5.4% 175 285
20-24 151 898 ⇐+2.5% 148 175
25-29 301 779 ⇐+1.9% 296 190
30-34 271 678 ⇐+5.7% 257 022
35-39 351 503 ⇐+6.7% 329 405
40-44 591 742 ⇐+4.9% 564 205
45-49 500 870 ⇐+5.5% 474 771
50-54 338 395 ⇐+5.5% 320 901
55-59 286 252 ⇐+4.5% 273 984
60-64 276 459 +2.3%⇒ 282 686
65-69 367 246 +13.6%⇒ 417 119
70-74 352 739 +24%⇒ 437 464
75-79 193 907 +33.4%⇒ 258 642
80-84 79 148 +49.5%⇒ 118 287
85-89 68 335 +63.7%⇒ 111 877
90-94 33 254 +113.1%⇒ 70 851
95-99 12 495 +165.4%⇒ 33 167
100+ 269 +83.3%⇒ 493

Sources: [1]

Ads

age of mother

Childrens per woman

Life expectancy at birth

First letter of the City


Filter by starting letters of the city (68 cities):
B (4) | C (6) | D (1) | F (1) | H (5) | J (4) | K (9) | L (4) | M (3) | N (2) | O (5) | P (7) | S (3) | T (5) | U (2) | V (3) | Z (4) |

Population for cities or regions in Czech Republic (68)

This is not full list. Only 50 largest cities in alphabetical order. You can click on start letter of the city ↑ :
Břeclav South Moravian
Brno South Moravian
Česká Lípa Liberecký
České Budějovice Jihočeský
Český Těšín Moravskoslezský
Cheb Karlovarský
Chomutov Ústecký
Děčín Ústecký
Frýdek-Místek Moravskoslezský
Havířov Moravskoslezský
Hodonín South Moravian
Hradec Králové Královéhradecký
Jablonec nad Nisou Liberecký
Jihlava Vysočina
Karlovy Vary Karlovarský
Karviná Moravskoslezský
Kladno Central Bohemia
Kolín Central Bohemia
Krnov Moravskoslezský
Kroměříž Zlín
Liberec Liberecký
Litoměřice Ústecký
Litvínov Ústecký
Mladá Boleslav Central Bohemia
Most Ústecký
Nový Jičín Moravskoslezský
Olomouc Olomoucký
Opava Moravskoslezský
Orlová Moravskoslezský
Ostrava Moravskoslezský
Pardubice Pardubický
Plzeň Pilsen Plzeňský
Písek Jihočeský
Prague Praha
Přerov Olomoucký
Příbram Central Bohemia
Prostějov Olomoucký
Sokolov Karlovarský
Šumperk Olomoucký
Tábor Jihočeský
Teplice Ústecký
Třebíč Vysočina
Třinec Moravskoslezský
Trutnov Královéhradecký
Uherské Hradiště Zlín
Ústí nad Labem Ústecký
Valašské Meziříčí Zlín
Vsetín Zlín
Zlín Zlín
Znojmo South Moravian

Sources, Notices

* Value is calculated with linear interpolation from 2 nearest estimated (date->population) data (unofficial).
** Net migration is included in Births with this calculation: Births = Population[1] + Deaths[1].
*** For years before 1950 we dont have population data. Value is approximate calculation using function: 1900 population = 70% of 1950 population.
[1] United Nations, Department of Economic and Social Affairs, Population Division (2015). World Population Prospects: The 2015 Revision. Data are estimates and projections according to a medium-fertility variant. Reused with the permission of the United Nations. Downloaded: 2015-11-15 (un.org)
[2] City density map, generated by population.city using data provided to us by 1km.net website. Every circle is city with population over 5000. Link
[3] Population density map generated by instructions from daysleeperrr on reddig. Link1. Used data source is the Gridded Population of the World (GPW), v3 online at the the Socioeconomic Data and Applications Center (SEDAC) at Columbia University. Link2. Additional urban land cover: Extracted from Global Land Cover Characteristics Data Base Version 2.0 and Binary MOD12Q1 data on shadedrelief.com. Link3 (PNG,0.5Mb).