Northern America · Population 1900-2100

Northern America · historical and predicted populations (both sexes) for the period 1900-2100 (millions) De facto population in Northern America as of 1 July of the year indicated. Source United Nations Population Division [1], [2].

What was the Northern America population at your birthday?*

Enter your birth date to find out. [1]
year:
month:
day:

Current Northern America population *

700000000

Today This year
Population growth Today
xx
Changes every 11.75 sec.
Population growth This year
xx
 
Births Today
xx
Changes every 5.507 sec.
Births This year
xx
Deaths Today
xx
Changes every 10.364 sec.
Deaths This year
xx

Sources: [1]
Today's statistic since midnight 00:00.
This year, statistic changes since 1st January
Population = Births** - Deaths

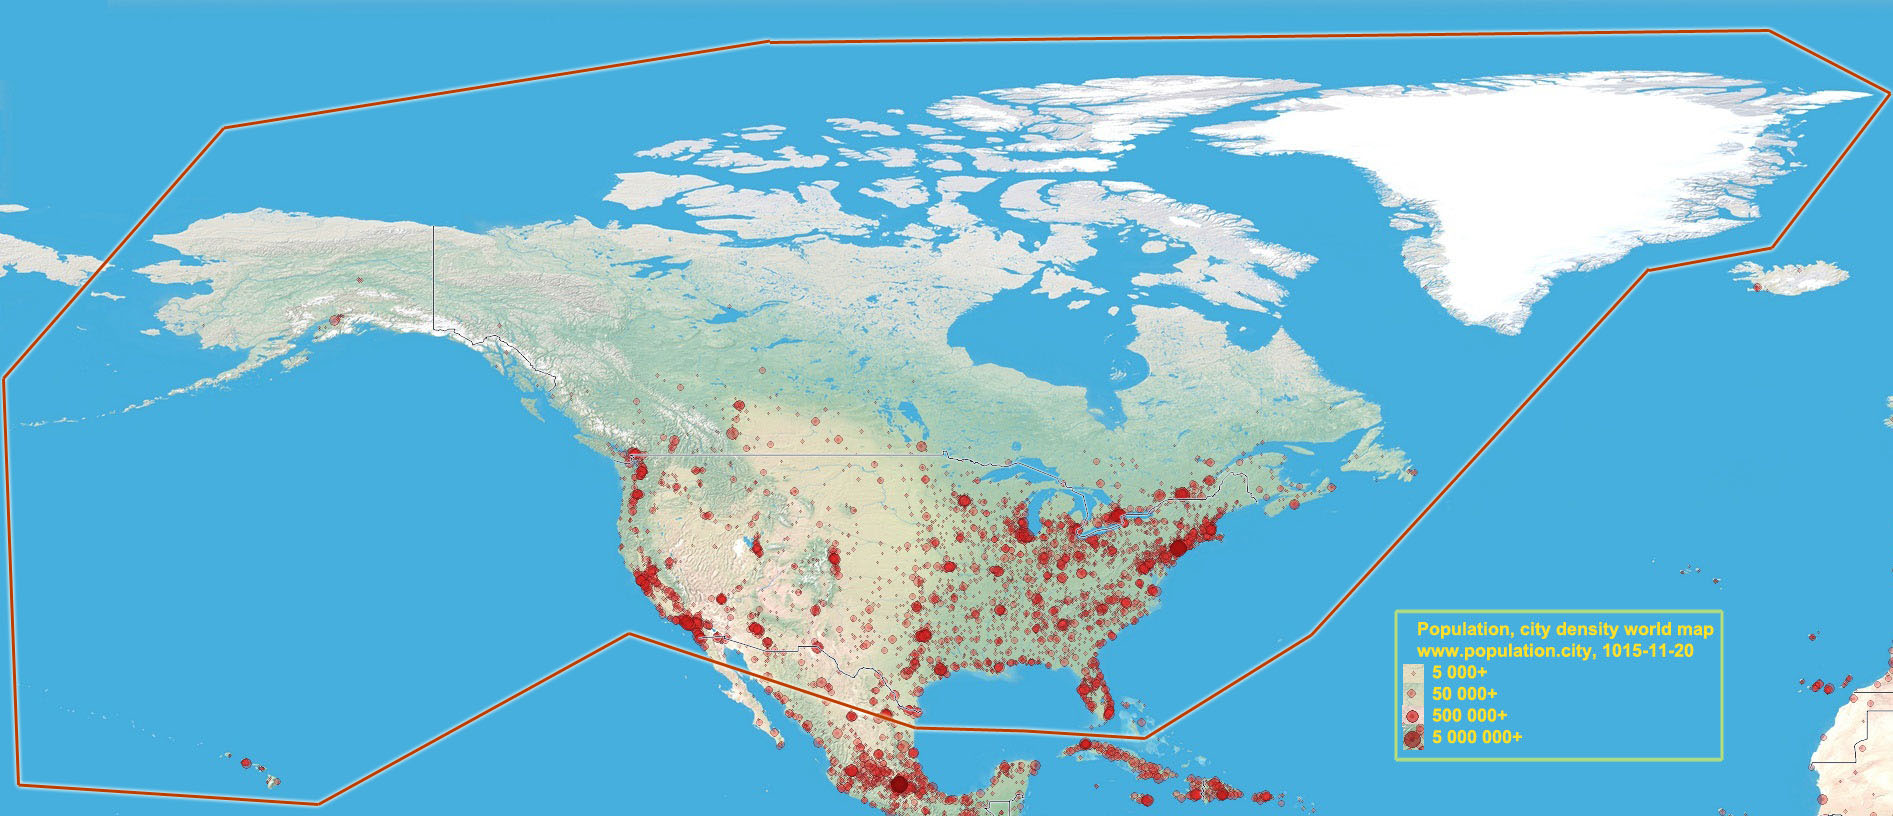
Northern America population map

City and population density Northern America map. Smallest red point means city with population of minimum 5000. Red circles are cities with population from 50.000 up to 10+ millions. You can zoom/move the map to see the details.

Northern America Demography

Current Northern America population by age and sex for 2025-07-18*

  Male % Female
0-4 10 507 308 ⇐+5.2% 9 988 247
5-9 11 936 232 ⇐+4.5% 11 427 276
10-14 12 500 538 ⇐+2.7% 12 168 671
15-19 10 765 305 ⇐+1.4% 10 614 354
20-24 12 397 063 ⇐+4.7% 11 837 316
25-29 14 605 477 ⇐+7.8% 13 552 411
30-34 13 925 799 ⇐+4.4% 13 334 688
35-39 12 922 836 ⇐+1.9% 12 685 723
40-44 10 814 118 +0.4%⇒ 10 862 703
45-49 10 424 927 +0.4%⇒ 10 467 760
50-54 10 758 635 ⇐+2.1% 10 535 515
55-59 13 975 327 +1.8%⇒ 14 231 596
60-64 12 970 222 +4.6%⇒ 13 563 328
65-69 11 203 108 +8.5%⇒ 12 157 509
70-74 9 294 107 +13.2%⇒ 10 516 971
75-79 5 343 929 +21.7%⇒ 6 502 997
80-84 3 175 132 +18.4%⇒ 3 760 328
85-89 2 051 937 +35.9%⇒ 2 787 666
90-94 1 230 080 +63.8%⇒ 2 015 408
95-99 259 197 +145.7%⇒ 636 945
100+ 26 867 +256.9%⇒ 95 875

Source: [1]

Ads

Population Growth rate (2015)

  • 7353 / day
  • 306.4 / hour
  • 5.11 / minute
  • 0.085 / seconds

Births Growth rate**

  • 15690 / day
  • 653.8 / hour
  • 10.9 / minute
  • 0.181 / seconds

Deaths Growth rate

  • 8337 / day
  • 347.4 / hour
  • 5.79 / minute
  • 0.096 / seconds

Sources, Notices

* Value is calculated with linear interpolation from 2 nearest estimated (date->population) data (unofficial).
** Net migration is included in Births with this calculation: Births = Population[1] + Deaths[1].
[1] United Nations, Department of Economic and Social Affairs, Population Division (2015). World Population Prospects: The 2015 Revision. Data are estimates and projections according to a medium-fertility variant. Reused with the permission of the United Nations. Downloaded: 2015-11-15 (un.org)
[2] Population for years before 1950: UN report – 2004 data. Downloaded 2015-11-15. (PDF)