Europe · Population 1900-2100

Europe · historical and predicted populations (both sexes) for the period 1900-2100 (millions) De facto population in Europe as of 1 July of the year indicated. Source United Nations Population Division [1], [2].

What was the Europe population at your birthday?*

Enter your birth date to find out. [1]
year:
month:
day:

Current Europe population *

700000000

Today This year
Population growth Today
xx
Changes every 77.709 sec.
Population growth This year
xx
 
Births Today
xx
Changes every 3.571 sec.
Births This year
xx
Deaths Today
xx
Changes every 3.743 sec.
Deaths This year
xx

Sources: [1]
Today's statistic since midnight 00:00.
This year, statistic changes since 1st January
Population = Births** - Deaths

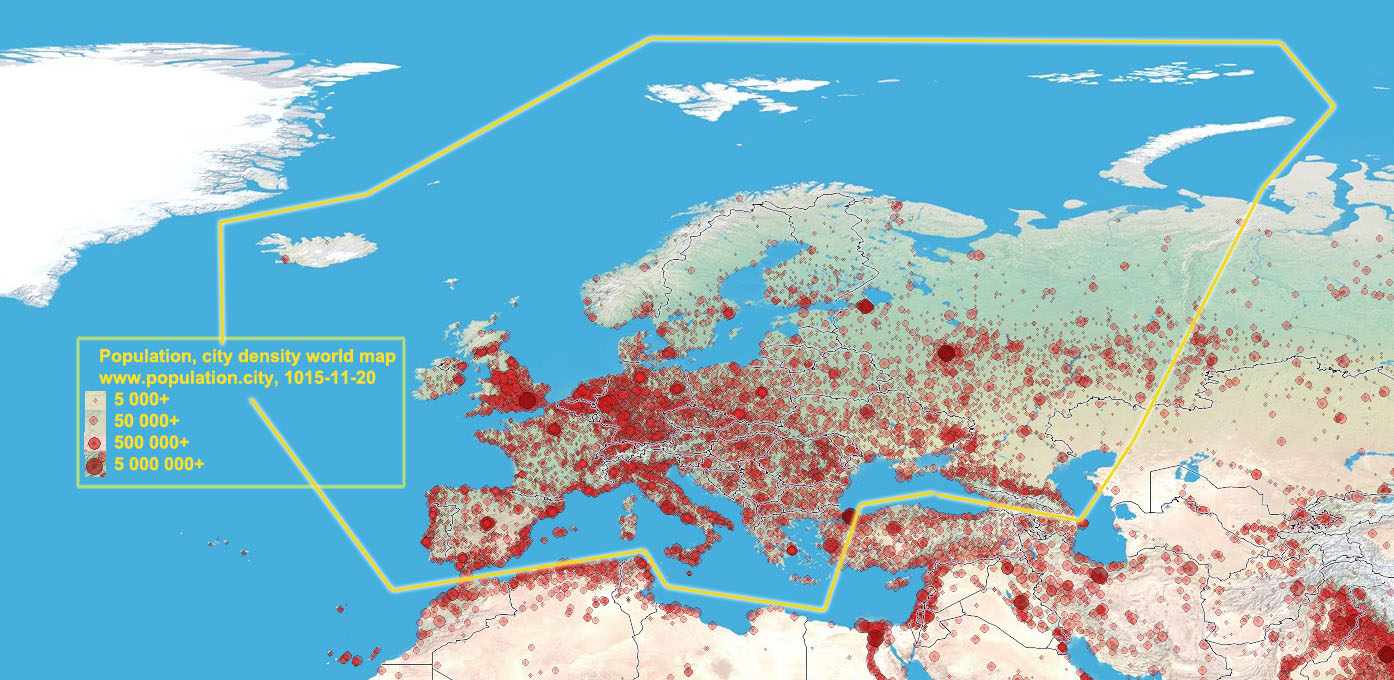
Europe population map

City and population density Europe map. Smallest red point means city with population of minimum 5000. Red circles are cities with population from 50.000 up to 10+ millions. You can zoom/move the map to see the details.

Europe Demography

Current Europe population by age and sex for 2023-05-30*

  Male % Female
0-4 19 306 082 ⇐+6.3% 18 169 342
5-9 22 022 819 ⇐+5.3% 20 910 560
10-14 20 729 854 ⇐+4.8% 19 784 975
15-19 17 406 433 ⇐+4.9% 16 589 462
20-24 16 796 503 ⇐+5.3% 15 949 456
25-29 22 100 857 ⇐+3.6% 21 322 910
30-34 26 830 196 ⇐+2.6% 26 141 435
35-39 26 071 924 ⇐+0.8% 25 853 501
40-44 25 180 703 +1.9%⇒ 25 657 065
45-49 24 250 875 +2.2%⇒ 24 776 113
50-54 25 110 723 +3.8%⇒ 26 073 826
55-59 26 165 809 +7.4%⇒ 28 102 841
60-64 23 688 374 +17.4%⇒ 27 821 206
65-69 21 509 011 +22.6%⇒ 26 374 331
70-74 14 908 602 +18.6%⇒ 17 674 636
75-79 9 920 696 +40.1%⇒ 13 900 028
80-84 8 864 400 +56%⇒ 13 825 017
85-89 4 625 583 +66.1%⇒ 7 680 867
90-94 2 446 950 +116.2%⇒ 5 291 139
95-99 445 828 +178%⇒ 1 239 190
100+ 28 239 +280%⇒ 107 317

Source: [1]

Ads

Population Growth rate (2015)

  • 1112 / day
  • 46.3 / hour
  • 0.77 / minute
  • 0.013 / seconds

Births Growth rate**

  • 24193 / day
  • 1008 / hour
  • 16.8 / minute
  • 0.28 / seconds

Deaths Growth rate

  • 23081 / day
  • 961.7 / hour
  • 16.03 / minute
  • 0.267 / seconds

Sources, Notices

* Value is calculated with linear interpolation from 2 nearest estimated (date->population) data (unofficial).
** Net migration is included in Births with this calculation: Births = Population[1] + Deaths[1].
[1] United Nations, Department of Economic and Social Affairs, Population Division (2015). World Population Prospects: The 2015 Revision. Data are estimates and projections according to a medium-fertility variant. Reused with the permission of the United Nations. Downloaded: 2015-11-15 (un.org)
[2] Population for years before 1950: UN report – 2004 data. Downloaded 2015-11-15. (PDF)