Asia · Population 1900-2100

Asia · historical and predicted populations (both sexes) for the period 1900-2100 (millions) De facto population in Asia as of 1 July of the year indicated. Source United Nations Population Division [1], [2].

What was the Asia population at your birthday?*

Enter your birth date to find out. [1]
year:
month:
day:

Current Asia population *

700000000

Today This year
Population growth Today
xx
Changes every 0.737 sec.
Population growth This year
xx
 
Births Today
xx
Changes every 0.422 sec.
Births This year
xx
Deaths Today
xx
Changes every 0.986 sec.
Deaths This year
xx

Sources: [1]
Today's statistic since midnight 00:00.
This year, statistic changes since 1st January
Population = Births** - Deaths

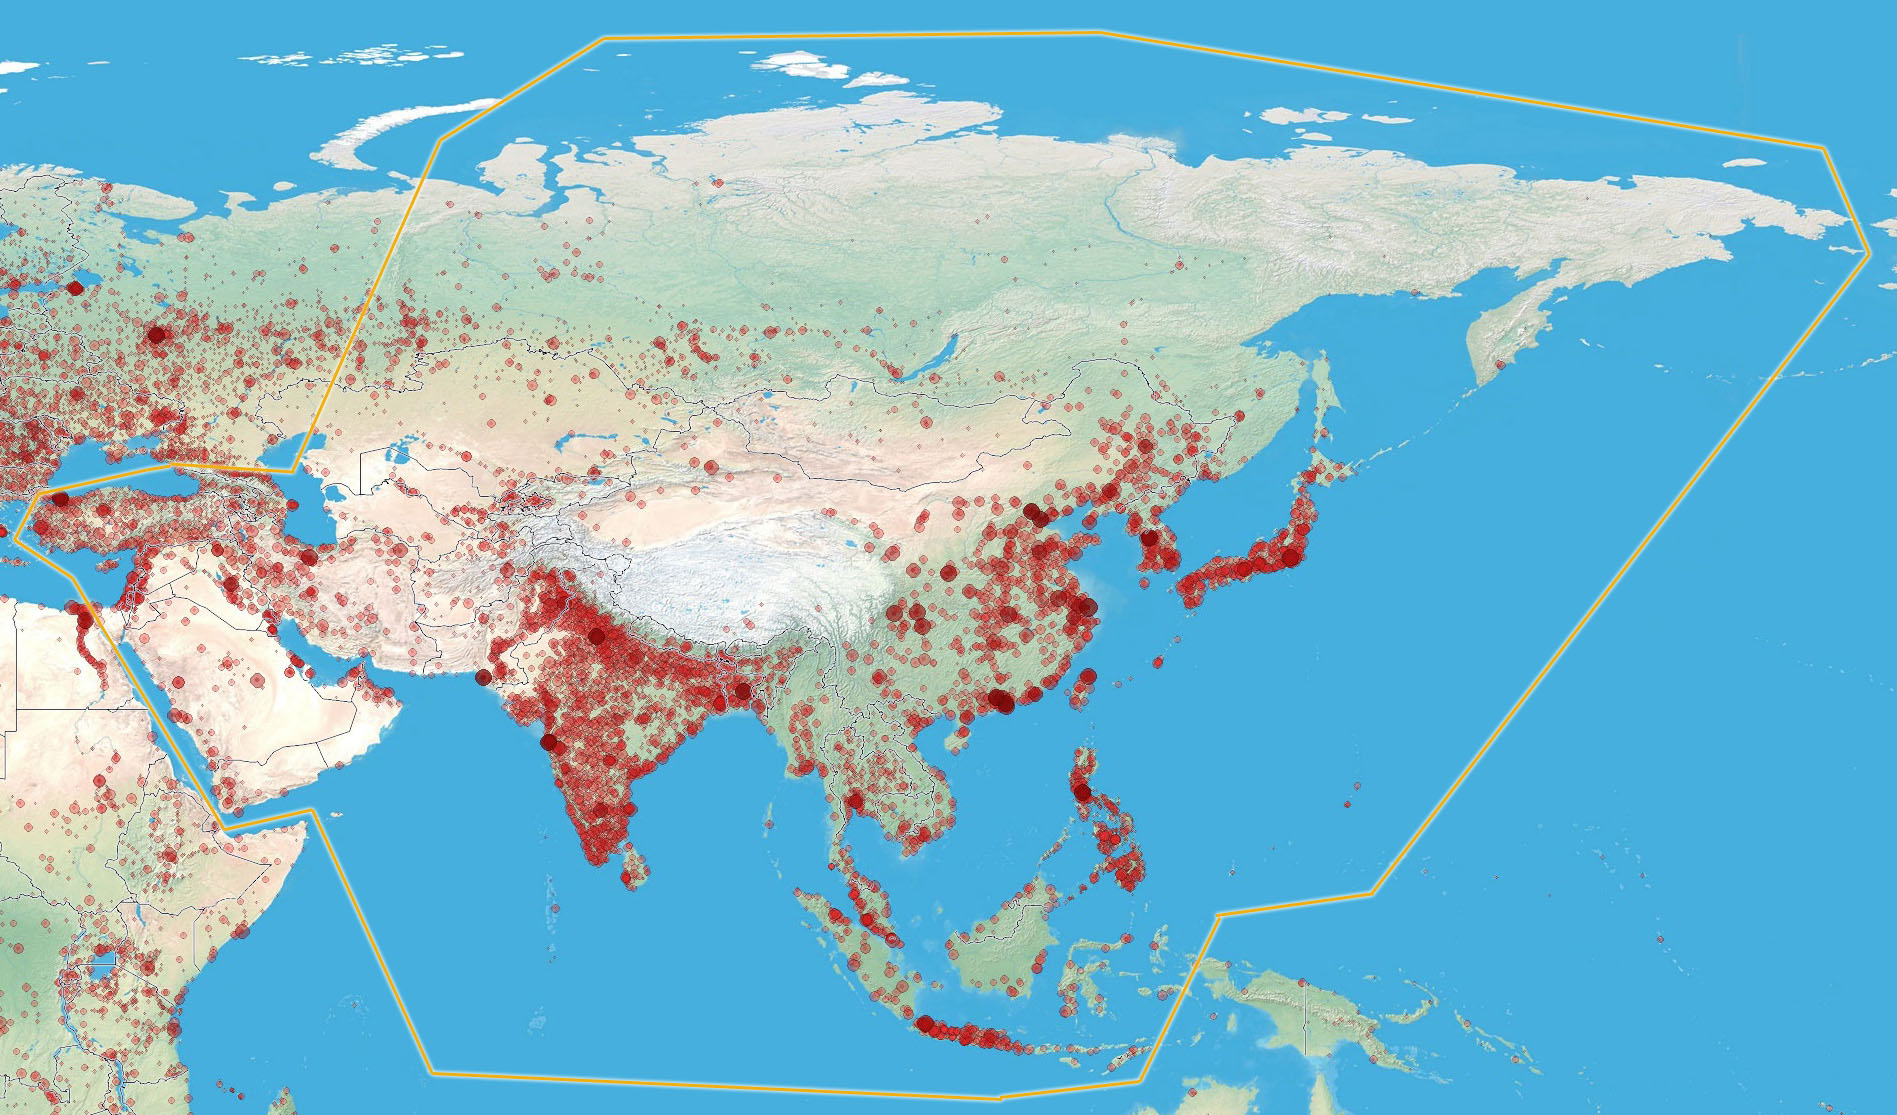
Asia population map

City and population density Asia map. Smallest red point means city with population of minimum 5000. Red circles are cities with population from 50.000 up to 10+ millions. You can zoom/move the map to see the details.

Asia Demography

Current Asia population by age and sex for 2025-10-19*

  Male % Female
0-4 194 848 293 ⇐+9.2% 178 406 264
5-9 196 785 985 ⇐+9.5% 179 689 295
10-14 188 697 832 ⇐+10.5% 170 718 673
15-19 171 873 707 ⇐+11.4% 154 229 356
20-24 166 582 092 ⇐+12% 148 773 986
25-29 207 080 895 ⇐+9.5% 189 075 552
30-34 221 370 779 ⇐+5.7% 209 428 101
35-39 168 194 289 ⇐+2.8% 163 686 505
40-44 152 004 815 ⇐+3.5% 146 832 719
45-49 175 277 110 ⇐+3.9% 168 696 390
50-54 168 525 926 ⇐+1.7% 165 743 422
55-59 128 708 976 ⇐+0.5% 128 056 966
60-64 109 191 707 +1.1%⇒ 110 404 429
65-69 95 620 525 +4%⇒ 99 441 492
70-74 52 704 935 +12%⇒ 59 044 166
75-79 33 122 451 +12.9%⇒ 37 400 774
80-84 22 855 569 +21.4%⇒ 27 748 755
85-89 12 212 875 +36.4%⇒ 16 652 343
90-94 4 813 733 +55.4%⇒ 7 479 359
95-99 740 798 +124.4%⇒ 1 662 470
100+ 88 523 +187.6%⇒ 254 572

Source: [1]

Ads

Population Growth rate (2015)

  • 117291 / day
  • 4887.1 / hour
  • 81.45 / minute
  • 1.358 / seconds

Births Growth rate**

  • 204951 / day
  • 8539.6 / hour
  • 142.32 / minute
  • 2.373 / seconds

Deaths Growth rate

  • 87660 / day
  • 3652.5 / hour
  • 60.87 / minute
  • 1.015 / seconds

Sources, Notices

* Value is calculated with linear interpolation from 2 nearest estimated (date->population) data (unofficial).
** Net migration is included in Births with this calculation: Births = Population[1] + Deaths[1].
[1] United Nations, Department of Economic and Social Affairs, Population Division (2015). World Population Prospects: The 2015 Revision. Data are estimates and projections according to a medium-fertility variant. Reused with the permission of the United Nations. Downloaded: 2015-11-15 (un.org)
[2] Population for years before 1950: UN report – 2004 data. Downloaded 2015-11-15. (PDF)